
You get a report every month. It has charts in it. Maybe some green arrows. And if someone asked you right now what your call-to-close rate is, or what one client is actually worth to your business over the next two years — could you answer without opening the report?
Most business owners can’t. Not because they’re not paying attention, but because most reports are built to look impressive, not to be understood. They’re full of numbers that measure activity, not the five numbers that actually tell you whether your marketing is working.
This post walks through those five — in plain English, with the formula for each, a real benchmark, and a 10-minute monthly routine to track them without needing a data team.
TABLE OF CONTENTS
→ Why Most Business Owners Can Only Name One Metric
→ The 5 Metrics That Actually Matter
→ The 10-Minute Monthly Tracking Routine
Why Most Business Owners Can Only Name One Metric
Ask any service business owner how marketing is going, and you’ll usually get one number back: leads. “We got 40 leads last month.” That’s the metric everyone tracks, because it’s the easiest one to see — it shows up right in the inbox.
The problem is that lead count on its own tells you almost nothing about whether marketing is actually working. Forty leads that never turn into a phone call are worse than fifteen leads that turn into five paying clients. Without the other four numbers, you can’t tell the difference between the two — you’re just watching a count go up.
This gap isn’t unique to small businesses, either. Even at the B2B enterprise level, research shows only 23% of sales leaders can accurately assess whether their own conversion rates are competitive — most are comparing themselves to outdated benchmarks or gut instinct. If sophisticated sales teams struggle with this, it’s not a personal failing that a solo business owner does too.
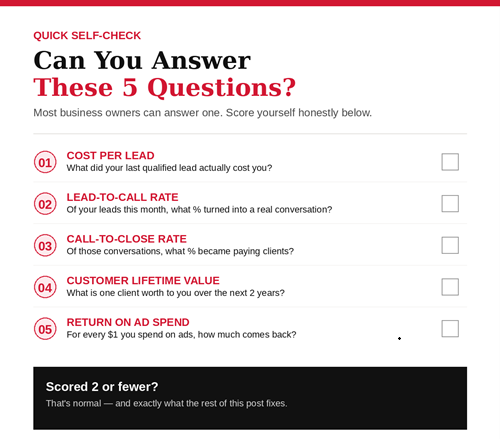
Here’s a fast gut-check before we go further:
The 5 Metrics That Actually Matter
Each of these answers a different question about your marketing. Skip one, and you’ll misread the other four.
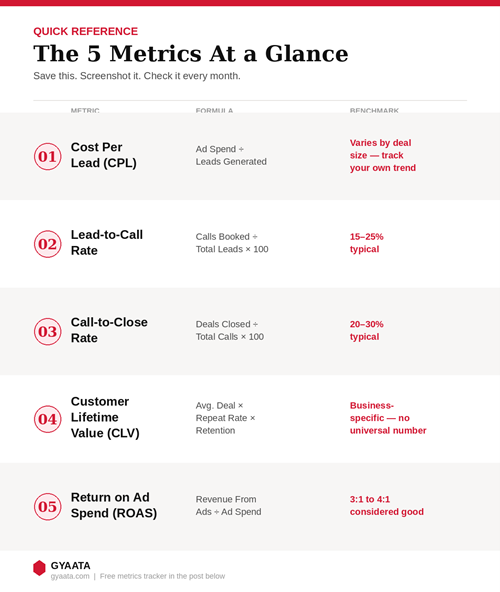
1. Cost Per Lead (CPL)
What it answers: What am I actually paying to generate one inquiry?
Formula: Total Ad Spend ÷ Total Leads Generated
There’s no single “good” CPL — it depends entirely on what a client is worth to you. A $150 CPL is a bargain if your average deal is $8,000. The same $150 CPL is a real problem if your average deal is $400. CPL only means something when it’s read next to the number below it — lead-to-call rate — and the one after that.
We’ve written a full breakdown of the six specific levers that lower CPL without cutting your ad budget in How to Reduce Cost Per Lead in 2026, if this is the one currently keeping you up at night.
2. Lead-to-Call Rate
What it answers: Of everyone who reaches out, how many actually become a real conversation?
Formula: Calls Booked ÷ Total Leads × 100
This is the number that tells you whether your leads are any good. Research on B2B funnels shows lead-to-meeting conversion typically runs in the 12–18% range even among well-run pipelines — for a service business with a shorter, more direct sales process, a healthy range typically lands closer to 15–25%. If yours is consistently under 10%, the issue usually isn’t your sales team — it’s that your ads are attracting the wrong audience, or your form isn’t filtering for real intent before someone submits it.
3. Call-to-Close Rate
What it answers: Of the people I actually talk to, how many become paying clients?
Formula: Deals Closed ÷ Total Calls × 100
Industry data on this varies more than any other metric on this list, mostly because businesses measure it differently. Measured from qualified pipeline specifically, opportunity-to-close rates commonly land in the 25–35% range, while broader B2B win-rate averages sit closer to 20% across all lead sources. If this number is low even though your calls feel like they go well, that’s rarely a marketing problem — it’s usually pricing, positioning, or an offer that isn’t quite landing.
4. Customer Lifetime Value (CLV)
What it answers: What is one client actually worth to me — not on day one, but over the life of the relationship?
Formula: Average Deal Value × Average Repeat Purchases × Average Retention Period
There’s no universal benchmark here, and any article that gives you one is guessing. What matters is that you calculate your own number and use it to decide how much you can rationally spend to acquire a client. A business that knows its CLV is $6,000 can confidently spend $400 to acquire a customer. A business that doesn’t know its CLV is guessing every time it sets a budget.
5. Return on Ad Spend (ROAS)
What it answers: For every dollar I put into ads, how much comes back?
Formula: Revenue From Ads ÷ Ad Spend
The commonly cited rule of thumb is that a 3:1 ratio is a reasonable starting target, with 4:1 (400%) generally considered a strong result for Google Ads specifically. But the honest, more useful version of this metric is your break-even ROAS — calculated as 1 ÷ your profit margin. At a 50% margin, you break even at 2:1. At a 20% margin, you need 5:1 just to avoid losing money, per the math laid out in Hawky’s 2026 ROAS guide. A 4:1 ROAS that sounds great in a report can still be a loss if your margins are thin — know your number before you celebrate someone else’s benchmark.
How These 5 Numbers Connect
These aren’t five separate metrics sitting in five separate reports. They’re one continuous chain, and a weakness anywhere in the chain shows up as a symptom somewhere else:
Ad spend → CPL → Lead-to-Call Rate → Call-to-Close Rate → a closed client → CLV over time, measured against what it cost you (ROAS).
This is why looking at any one number in isolation is misleading. A business with a rising CPL might not have an ads problem at all — it might have a lead-to-call problem, where poor-quality traffic is inflating the apparent cost of a “real” lead. A business with a low ROAS might have a perfectly efficient ad account and a genuinely low CLV, meaning the real fix is pricing or retention, not media buying.
This full-chain view is exactly what we build into every client’s reporting on the Demand Generation & Pipeline Acceleration side of our work — because a number without its neighbors is just a number, not an insight.
The 10-Minute Monthly Tracking Routine
You don’t need a dashboard, a data analyst, or new software to track all five. A simple monthly routine on the first Monday of every month:
- Pull total ad spend and total leads from your ad platforms — calculate CPL.
- Count how many leads became booked calls from your CRM or calendar — calculate lead-to-call rate.
- Count how many calls became clients — calculate call-to-close rate.
- Check in on CLV once a quarter, not monthly — it moves slowly and doesn’t need weekly attention.
- Pull revenue attributed to ads from your ad platform’s conversion tracking — calculate ROAS.
Ten minutes, four numbers recalculated, one you revisit quarterly. That’s the entire system — no dashboard subscription required.

FAQs
1. What’s the single most important metric on this list?
If you can only track one, make it lead-to-call rate. It’s the earliest point in the funnel where you can tell whether your marketing is attracting the right people, and problems here are usually the cheapest to fix.
2. How often should I actually look at these numbers?
CPL, lead-to-call rate, and call-to-close rate are worth checking monthly. ROAS is worth checking monthly too, but don’t overreact to a single bad month — look at the trend across three. CLV moves slowly; quarterly is enough.
3. My numbers are all below benchmark. Should I panic?
No — benchmarks are a reference point, not a verdict. What matters more is your own trend over time. A business steadily improving from a 10% call-to-close rate to 15% is in a stronger position than one flat-lined at a “good” 25%.
4. Do these benchmarks apply to every industry the same way?
Directionally, yes — but the exact numbers shift by deal size, sales cycle, and industry. Use the benchmarks in this post as a general reference, then build your own baseline from your first two or three months of consistent tracking.