“My ads are getting expensive, and I don’t know how to bring the cost down without spending more.”
If that’s the thought running through your head every time you check the ad dashboard, you’re reacting to a real trend, not just bad luck. Meta ad costs per lead rose 21% year-over-year, and competitive B2B keywords on Google now run $50-150 per click with only 2-5% converting. In some contested categories CPL has been pushed to as high as $1,000-7,500. What separates businesses that adapt from businesses that just pay more is whether they know how to reduce cost per lead without touching the budget line at all.
That’s the part most advice gets wrong. The instinct when CPL climbs is to either cut spend (and lose volume) or increase spend (and hope the algorithm compensates). But the data consistently shows the biggest CPL reductions come from six specific, non-budget levers. They are: targeting precision, offer-audience match, landing page conversion, pre-qualification, creative freshness, and follow-up speed. This blog breaks down each one, with the actual numbers behind it, so you know exactly where to look first.
1. Audience Targeting Precision
Broad targeting is the single most common reason CPL creeps up quietly. It produces cheap clicks that don’t convert. These clicks look fine on a CPC dashboard and terrible on a CPL one. Narrowing audience definition increases the cost of individual ad clicks but improves qualification rates and downstream conversion, meaning the leads that do come through are dramatically more likely to actually close.
The compounding data point here comes from platform-specific benchmarks: audience refinement alone contributes a documented 15-30% CPL reduction, separate from anything done on the landing page or creative side. On Meta specifically, eliminating audience overlaps is one of three changes shown to deliver 30-45% CPL reduction within just 2-3 weeks, alongside server-side tracking and mobile landing page fixes.
The practical takeaway: if your CPL has crept up, the first question you should be asking is – “how overlapping and broad is my current targeting, and what happens to lead quality if I narrow it.”
2. Offer-Audience Match
This is the least visible lever, but it decides how every other lever performs. A perfectly targeted, well-designed landing page still fails if the offer itself doesn’t match what that specific audience actually wants at that moment in their decision.
The data on this shows up indirectly, through offer-type CPL variance: on LinkedIn, gated content leads average around $45, webinar registrations around $55, demo requests around $115, and “contact sales” requests around $150. The same audience is reachable at dramatically different costs, purely because of what’s being asked of them. A “book a demo” ask targeted at someone who’s never heard of your product will always cost more per lead than a lower-commitment offer matched to where that audience actually sits in their buying journey.
The fix isn’t complicated, but it’s frequently skipped: match the size of the ask to the audience’s actual intent level, rather than defaulting to your highest-value CTA for every campaign.
3. Landing Page Conversion Rate – The Highest-Impact Lever
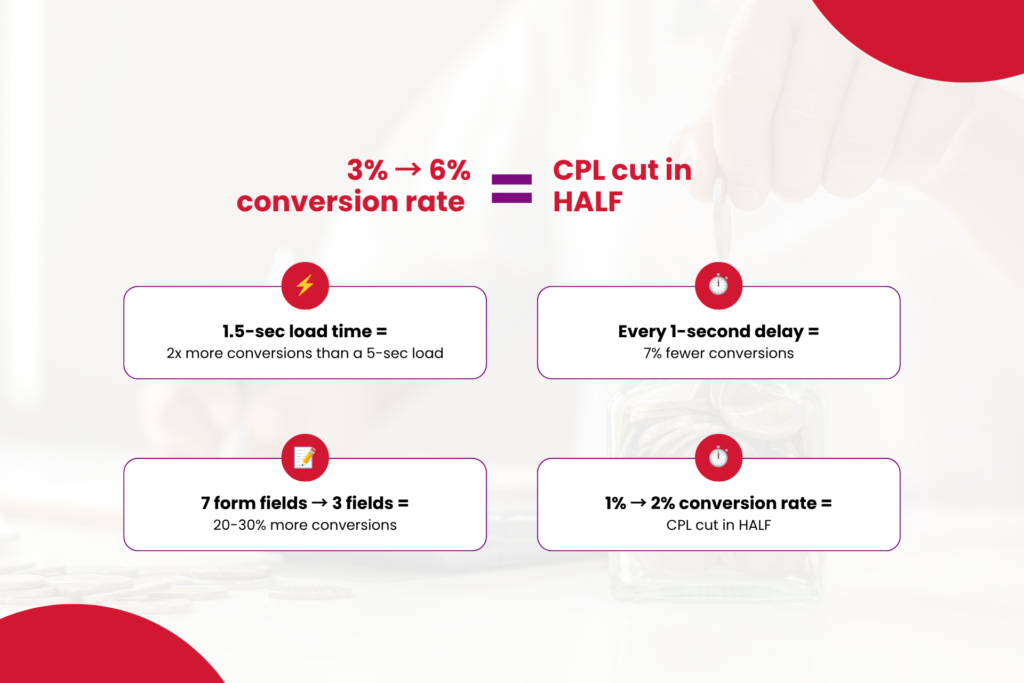
If you fix only one thing on this list, this is the one. The highest-impact lever for CPL reduction is landing page conversion rate. Improving landing page conversion from 3% to 6%, cuts CPL in half, without touching ad spend at all. This is pure arithmetic: the same ad spend, the same traffic, simply converting at a higher rate.
The supporting data is remarkably consistent across sources:
- A landing page that loads in 1.5 seconds converts roughly twice as well as one that loads in 5 seconds, and separately, a 1-second delay in page load can decrease conversions by 7%.
- Simplifying forms from 7 fields down to 3 fields improves conversion rates by 20-30%, directly reducing CPL by roughly the same margin.
- Improving conversion rate from just 1% to 2% literally cuts CPL in half. This math scales at every level, not just for pages already performing well.
- At scale, the dollar impact is significant: a 1% conversion rate improvement on a landing page receiving 5,000 monthly paid visitors generates 50 additional leads per month at zero additional spend. This is worth $10,000 in lead value at a $200 CPL, from a page fix alone.
- Industry baselines vary meaningfully: SaaS companies see a median 3.8% landing page conversion rate, while financial services see 8.4%. This is worth knowing so that you’re benchmarking against your actual category, not a generic average.
This is precisely the pattern behind the intro stat: businesses restructuring landing pages consistently see CPL drop 30%+ within weeks, because this lever doesn’t depend on the algorithm learning anything or the market shifting, it’s a direct, controllable input.
4. Pre-Qualification Before the Ad Click
Not every lead is worth the same. Pre-qualification using form logic, lead scoring, or platform-native qualification tools before a lead ever reaches sales, changes which leads you’re paying for, not just how many.
The clearest data point here comes from format comparison: LinkedIn’s native Lead Gen Forms reduce CPL by 25-35% compared to external landing pages, largely because pre-filled fields and a frictionless native experience pre-qualify intent before the click even completes. On the automation side, automated lead scoring identifies high-value prospects immediately, enabling faster, more targeted follow-up that improves downstream conversion without adding spend.
There’s an important nuance worth sitting with here: optimizing CPL in isolation is counterproductive, because the cheapest leads often produce the most expensive customers. A $40 CPL with a 20% close rate produces a $200 cost per acquisition; an $80 CPL with a 50% close rate produces just $160. Pre-qualification is often why the second scenario happens — it filters out the cheap-but-unlikely-to-convert leads before they enter your funnel at all.
5. Creative Refresh Before Fatigue Sets In
Ad creative doesn’t fail because it was bad. It fails because it got shown to the same audience too many times, and CPL quietly rises as engagement decays, often before anyone notices.
The decay curve is now well documented: roughly half of all ad creatives are turned off before 28 days, and only 4-8% ever qualify as genuine winners, based on an analysis of 550,000+ ads and $1.3 billion in ad spend. Fatigue timelines vary sharply by category. For example, fashion ads fatigue in about 11 days, food and beverage in just 9, while home and garden ads last up to 21. This clearly states that a one-size-fits-all refresh calendar is rarely the right approach.
The leading indicators matter more than waiting for CPL to visibly rise: a CTR drop of 15% or more against a rolling baseline, rising CPM without added scale, a declining hook rate, and weekly frequency climbing above 2.5-3.5 on prospecting campaigns all signal fatigue building before cost per lead actually shows the damage. By the time CPL confirms the problem, you’re typically already two to three weeks behind the fix. Brands that stay ahead of this aren’t refreshing on a fixed calendar. They are running 15-50+ new creative variants per month, which extends campaign life 3-5x compared to quarterly refresh cycles.
6. Follow-Up Speed — The Lever Most Businesses Ignore Completely
This is the lever that has nothing to do with ad platforms at all, and it may be the most underrated one on this list. A lead that costs $80 to generate and then waits three days for a follow-up call has effectively had its cost per lead multiplied because the odds of it ever converting have collapsed by the time someone finally reaches out.
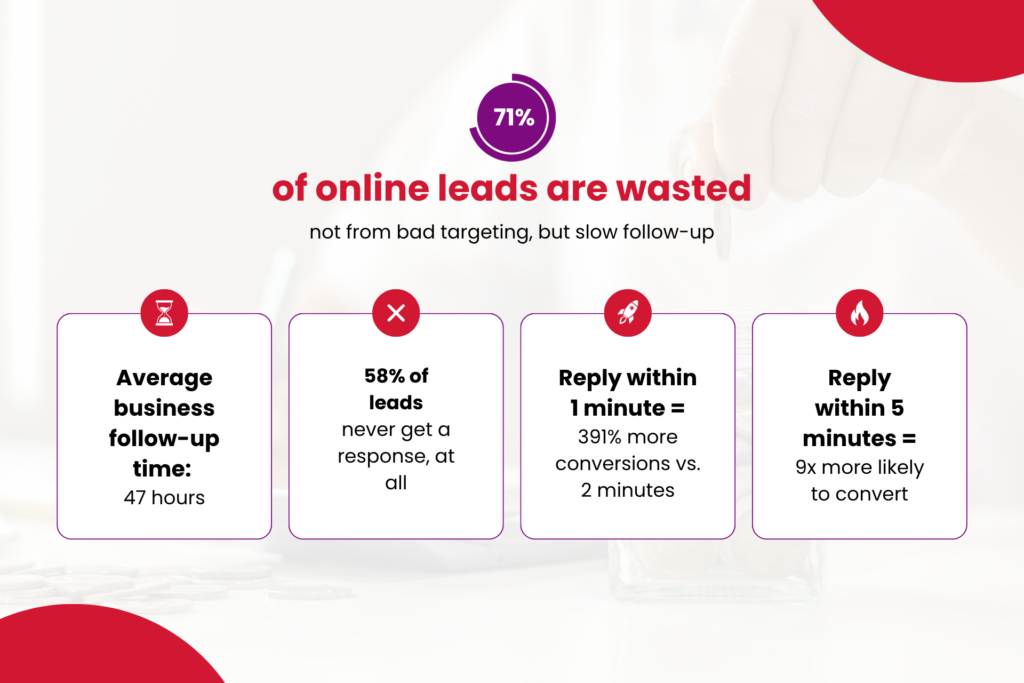
The numbers here are stark. The average business takes 47 hours to follow up with a new lead, and 58% never respond at all. Meanwhile, 71% of online leads are wasted simply because businesses fail to follow up quickly enough. This means a large share of “expensive” CPL is actually a follow-up problem wearing a targeting problem’s clothes.
The conversion math on speed is dramatic: responding within 1-minute increases conversion by 391% compared to responding after just 2 minutes, and B2B leads contacted within 5 minutes are 9x more likely to convert than leads contacted later. Businesses that move from a typical 24-hour response window down to sub-5-minute response have documented conversion rate improvements exceeding 900%. Notably, 82% of B2B buyers now expect an immediate response to a sales inquiry, meaning “fast” isn’t a competitive edge anymore, it’s a baseline expectation quietly working against every business that’s slower than it.
Why These 6 Levers Compound Rather Than Compete
None of these six operate independently, and treating them as a checklist to work through one at a time understates the actual opportunity. Better landing pages make targeting more effective. Higher-quality leads improve the ad platform’s bidding algorithm. Fresh creative keeps remarketing audiences engaged and each lever strengthens the others. Businesses that optimize all three layers of targeting, creative, and post-click experience simultaneously and consistently, post the lowest CPLs in their industry, rather than businesses chasing one fix in isolation.
Given that, the practical advice isn’t “fix everything at once.” It’s starting with 2-3 high-impact levers that address your biggest, most obvious gap, and layering additional fixes over time. This lets each optimization compound the next rather than trying to overhaul every lever simultaneously and losing track of what’s actually driving the improvement.
How Gyaata Approaches Cost Per Lead
Most CPL conversations start with the ad account, because that’s where the spend is visible. We tend to start somewhere else. We start with the six levers above, mapped against where a specific business is actually losing the most money, before touching a single bid or budget line.
In practice, that means looking at a client’s landing page conversion rate before recommending a targeting change, since a 3% page fixed to 6% often solves more of the problem than any amount of audience refinement could. It means checking how a lead is actually followed up on because a beautifully targeted, well-converted lead that sits unanswered for two days has already lost most of its value regardless of how little it cost to acquire. And it means treating creative refresh as a scheduled discipline tied to actual fatigue signals, not a reactive scramble once CPL has already climbed.
None of this is about spending more to fix a spending problem. It’s about being precise about which of the six levers is actually costing a given business the most right now, and fixing that one first, which is usually where the fastest, most defensible CPL improvement comes from.
Where to Start
If your CPL has been climbing, resist the instinct to immediately increase budget or slash targeting in a panic. Start by identifying which of these six levers is weakest for your specific funnel right now. Often the problem is the landing page conversion, given how directly it moves the number, or follow-up speed, given how commonly it’s ignored entirely. Fix that one lever, measure the actual CPL change, and then move to the next. The businesses posting 30%+ CPL reductions aren’t spending their way there, they’re actually working through this list with discipline.

FAQs
1. What’s the single fastest way to reduce cost per lead?
Landing page conversion rate is typically the highest-leverage fix, since improving it from 3% to 6% cuts CPL in half without any change to ad spend or targeting and improvements here are usually testable and visible within days, not weeks.
2. Is a lower CPL always better?
Not necessarily. The cheapest leads often produce the most expensive customers. A $40 CPL with a 20% close rate can cost more per customer than an $80 CPL with a 50% close rate. The more useful metric is CPL adjusted for lead quality and close rate, not raw cost per lead alone.
3. How often should ad creative actually be refreshed?
It depends heavily on category, fashion and food/beverage ads fatigue in 9-11 days, while home and garden ads can last up to 21. But the better approach is watching leading indicators like CTR decline and rising frequency rather than refreshing on a fixed calendar.
4. How much does follow-up speed actually matter compared to ad optimization?
More than most businesses assume. 71% of online leads are wasted due to slow follow-up, and responding within 5 minutes makes B2B leads 9x more likely to convert. This means a perfectly optimized ad funnel can still underperform badly if follow-up is slow.
5. Should small businesses focus on all 6 levers at once?
No, the strongest results come from starting with 2-3 high-impact levers that address the biggest visible gap, then layering in additional fixes over time as each optimization compounds the next.